

An inventory control chart is an immensely helpful tool for demand forecasting and inventory management. It helps businesses determine when to reorder stock, and how much of it to order.
What is an inventory control chart?
An inventory control chart, also known as a stock control chart, is a visual diagram that reflects the minimum and maximum stock levels of a business over time.
The Y axis of an inventory control chart represents order quantities. The X axis represents time. Lines and points are added to the chart to show min and max stock levels, reorder quantities, and supplier lead times.

The definition of inventory control chart is a chart that displays the lifecycle and replenishment factors of a product being sold by a business.
Key features of an inventory control chart:
- Order size – The quantity of units per order.
- Maximum stock level – The largest number of units to be stocked at any one time.
- Minimum stock level – The lowest number of units to be stocked at any one time.
- Re-order level – The quantity of stocked units that triggers a replenishment.
- Supplier lead times – The average time it takes for an order to arrive after you have placed it with the vendor.
- Safety stock level – The quantity of reserve units stocked in case inventory is not replenished in time to meet demand.
What are inventory control charts used for in business?
Stock control charts are used in business to understand inventory cycles, prevent over or understock, and free up cash flow. It helps purchase managers determine the optimal reorder and safety stock levels based on historical company data.
The primary purpose of an inventory control chart is to help you set a reorder quantity that equals the perfect amount of stock necessary to maximise cash flow and keep customers happy.
Core benefits of using inventory control charts in business:
- Unlock cash flow for other areas of the business
- Prevent overstocking
- Prevent understocking
- Optimise replenishment quantities
- Optimise reorder times
- Adjust safety stock levels
- Identify customer demand trends and seasonality
- Improve demand forecasting
Inventory control charts are a visual indicator of how your product sells. They tell you how much you’re selling, how much buffer stock you’re holding, and how long it’s taking to get to you.
This information is valuable to any business looking for ways to cut excess costs and improve efficiencies. Here’s an example of how a stock control chart might save you money:
You discover that a product is selling faster in winter, and your suppliers are also taking longer to deliver during those months. If you don’t increase your safety stock and reorder point quantities, you won’t be adequately prepared to meet customers’ expectations.
Thanks to the inventory control chart, you can identify this risk and adjust those levels in time for winter. Without it, your business might suffer reputational damage, a higher volume of cancelled orders, and additional shipping fees.
- Learn more: Easy 10-Step Product Strategy Framework Guide
Inventory control chart example
Stock charts provide clarity around stock levels and inventory cycles by providing a visual medium for digesting the information. And we’d be remiss if we didn’t include an inventory control chart example of our own:
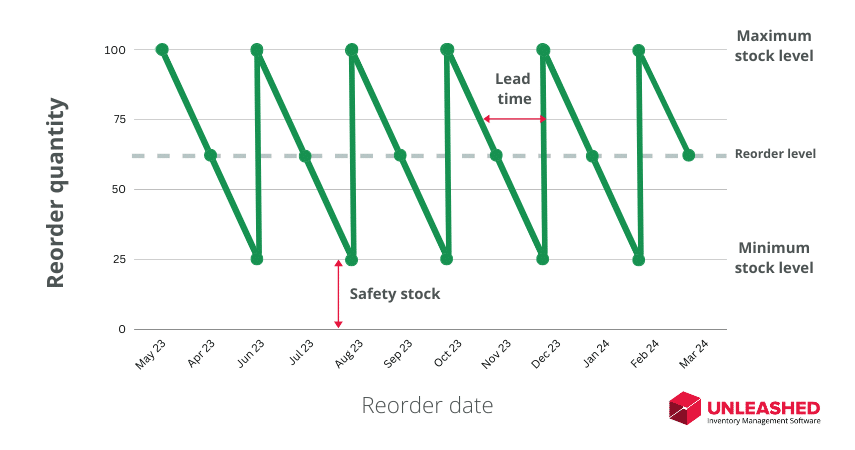
In the stock control chart example above, we can see that the maximum stock level is set to 100 and the minimum stock level is set to 25. This means the safety stock level for this product is set at 25 units.
We can also see that the reorder level is set to about 62 units, and the lead time is around half a month.
With longer lead times and increased demand, safety stock becomes increasingly important. If a product sells faster than usual or takes a bit longer to arrive, safety stock is there to make sure customer orders are not delayed as a result.
This chart tells us that the lead times and customer demand remained the same all year. In reality, supply chain disruptions, seasonality, and Christmas can greatly affect sales and deliveries.
Inventory control charts are useful for quickly seeing exactly how great an impact external factors have on the product’s lifecycle, so you can prepare for them in advance.
How to create an inventory control chart
To create an inventory control chart for a product, you need to know its:
- Min and max stock levels
- Reorder levels
- Safety stock levels
- Replenishment quantities
- Reorder dates
- Supplier lead times for each delivery
Ideally, you’ll want a year’s worth of data.
If you don’t have that, you can still make a stock control chart with what you have. You’ll just run the risk of getting a less accurate picture of your product’s lifecycle, which can be crucial if your business is affected by seasonality.
It can take a long time to locate all the necessary inventory data if you aren’t using an efficient inventory system. With sophisticated inventory management software like Unleashed, you have access to many advanced reporting features, inventory control charts, and business intelligence tools.
You won’t need to dig through old filing cabinets and confusing spreadsheets to understand the lifecycle of your product. It will be available to view anytime from directly within the Unleashed dashboard.
However, if it doesn’t make sense for your business to be using inventory management software you can still do it the old-fashioned way.
First, we need to calculate the data needed to create an inventory control chart.
Inventory control chart calculations
Inventory control chart calculations are not necessary if you’ve been keeping records of your transactions and product data. All the information can be found without using arithmetic.
However, if you’re looking to start tracking the right inventory metrics to review in a stock control chart later, here are the steps.
Let’s start by working out your safety stock.
You can calculate safety stock using this formula:
(Maximum Daily Usage x Maximum Lead Time in Days) – (Average Daily Usage x Average Lead Time in Days) = Safety Stock.,