
Types of inventory reports you need to know about
Home » Inventory Management Guide » Types of Inventory Reports
To successfully grow your business, it is essential to manage your inventory as accurately and optimally as possible. Now that you know about the essential inventory reporting metrics, you can start using the appropriate inventory reports to track success across:
- Purchasing
- Production
- Inventory stock
- Sales orders
Purchase Management Reporting
A purchase management report provides a snapshot of how effective the purchasing strategy is. It allows your business to show how its current purchasing activities deliver value for money and realises the company’s goals.
Here are three key metrics to get you started:
1. Average lead time by supplier
Lead time is the difference between the day a purchase order was raised and when it was received. Businesses should aim to reduce lead times as much as possible while still sourcing good quality products or components. If longer lead times are unavoidable, then accurate forecasting is a must to avoid stockouts or overstocking.
2. Supplier delivery
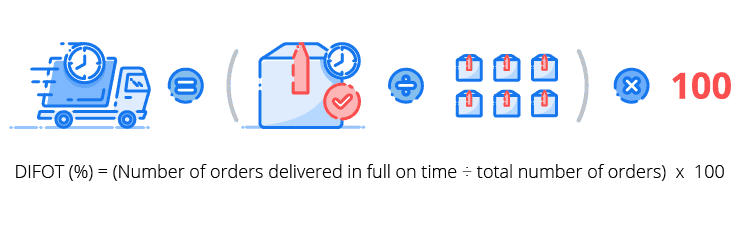
Delivery in full, on time (DIFOT) is a metric that takes a look at product or service delivery from your suppliers. It shows the percentage of orders you received in full by the requested date, compared to your overall number of orders. DIFOT is calculated as:
3. Supplier returns
Supplier returns are goods returned to your suppliers, or services not used or received by you from your suppliers.
Optimising procurement example
By analysing your purchasing activities, you identify two suppliers that stand out. Supplier A delivers within a short lead time of 3 days but frequently miss out items. On the other hand, Supplier B takes longer to deliver their order, with a lead time of 5 days. However, you find that their DIFOT rate is much higher than Supplier A: they always deliver in a timely fashion and the delivered quantity always matches what was ordered.
From your purchase management report, you know that although Supplier A seems like a better supplier because of their short lead time, Supplier B always delivers the right products every time.
You adjust your purchasing strategy to take into account the longer lead time, but always end up with the right products that don’t need to be returned.
Production Management Reporting
A comprehensive production report helps maintain an overview of your business’ production performance and profitability so you can evaluate efficiencies and improve production strategies. Let’s take a look at the key metrics that drive production improvement.Cycle time
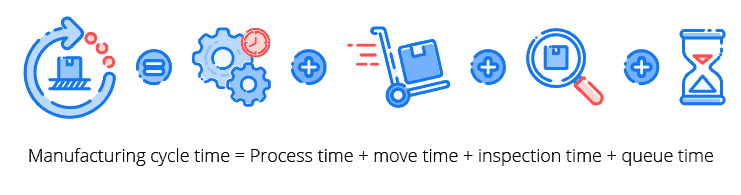
Manufacturing cycle time tells you how much time it takes to convert raw materials into finished goods. It involves the following components:- Process time — the time used to actually work on the product.
- Move time — the time required to transfer the product from one workstation to another.
- Inspection time — the time spent to check if the product is free from any defect.
- Queue time — the idle time the product spends waiting to be moved, processed, inspected, and shipped.
Production efficiency
Production efficiency measures whether a business is producing the largest amount of goods possible without wasting resources. When a business has production efficiency, they are manufacturing products at a low average total cost.
Efficiency vs Productivity
Efficiency is not the same as productivity. Productivity is about maximising the number of units produced within a given timeframe, while efficiency is about minimising costs and maximising profits for a given level of output.
Standard output rate is your staff’s normal rate of performance. Operations strategy, technology, job design, the worker’s skill and effort all influence the rate of output.
Wastage
Regardless of what business you’re in, there’s sure to be wastage as a consequence of the business — and not just the physical waste. Here’s a quick refresher on the types of inventory waste you might be accumulating.
Production cost
Production costs detail the total cost of manufacturing a product — including raw materials, third-party assembling costs and operating costs. For manufacturers, production costs typically make up a large part of their total COGS.
Stock reporting
Without knowing about your stock movements, you could be letting inventory management get the better of you. Stock reports like turnover reports and inventory variance reports can help you keep your products fresh and relevant.
Inventory discrepancy report / inventory variance reporting
Once you’ve completed your stocktake, you might find that there is an inventory discrepancy — a difference between the actual stock and what is reported in your inventory management software.
Stock discrepancies spell bad news for your business as they often hint at a bigger inventory control problem. In this case, businesses should create an inventory variance report to detail the movement of stock between stocktakes and differences that have occurred. It’s used to analyse stock movement and ensure that all stock is accounted for correctly.
Stocktake discrepancy
Are there any discrepancies in your counted and reported stock levels? Understanding the reasons why this is happening can help your business grow:
- Stock loss due to damage or theft
- Stock is not in the correct location
- Human error during stocktake process
- Stock is labelled with incorrect identification
- Stock mistaken for similar product
- Inbound stock not recorded accurately
- Faulty stocktake software or equipment
- Counting using the incorrect unit of measurement
Learn more about resolving your stocktake discrepancies.
Knowing how much stock to hold
Holding the right amount of inventory is a crucial factor in the success of any product-based business. Keep too much on hand, and you’ll soon find holding costs eating into your margin — not to mention running the risk of your stock becoming unusable before you can sell it.
On the other hand, keeping your levels too lean means increasing the likelihood of stockouts. And you can’t sell what you don’t have.
A perpetual IM system should be capable of reporting on the value of stock on hand at any given time, as well as comparing it to previous periods. It should also tell you your purchase value: that is, how much money you currently have invested in your stock.
Here are some essential metrics to keep in mind when creating a stock report:
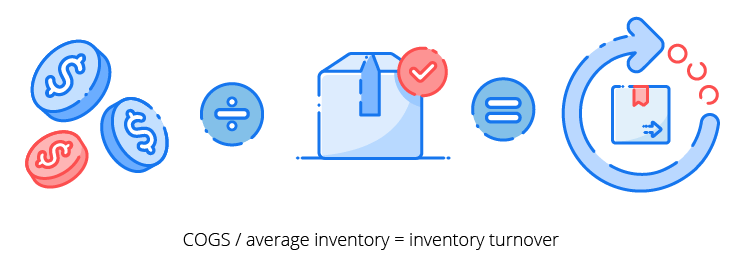
1. Inventory turnover
Inventory turnover is a ratio showing how frequently a business has purchased and sold inventory during a given period. It helps a business make well-informed pricing, manufacturing, marketing and purchasing decisions.
How to calculate inventory turnover rate
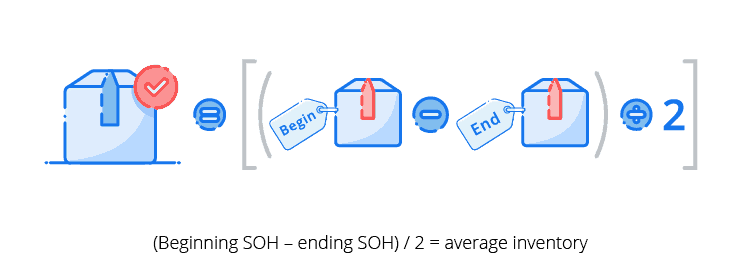
To calculate inventory turnover, you’ll need two figures: your cost of goods sold and your average inventory. To work out your average inventory (AI), minus your total stock on hand from the end of the period you want to analyse from the total at the beginning and divide the figure by two.
What the inventory turnover rate tells you
Specific inventory turnover ratios vary between industries but generally, the quicker your inventory turnover, the lower the risk of deterioration — especially if you carry perishable products. High turnover often indicates strong sales, suggesting profitability and good return on investment. However, it could also represent a failure to manage purchasing. This in turn leads to large discounts in an attempt to get rid of slow-moving stock.
As QuickBooks suggests, low inventory turnover could mean a business is holding more stock than they realistically need or that the business is experiencing weak sales. Regardless, low turnover represents capital tied up in stock and signals a bigger problem: poor inventory management.
Depending on your business, low turnovers might not be of concern. For example, businesses selling premium products that produce very high profit margins will have a lower turnover than a grocery store selling perishable products.
Learn how to improve your inventory turnover rate
The importance of inventory turnover rates
Identify efficiency
The inventory turnover ratio helps a business identify efficiency. It can show:
- How much stock they should actually hold
- Which products are selling well — and which aren’t
- Where deadstock is in the warehouse
- Predict performance and profitability
At the heart of it, inventory is an asset that the business holds with the intent to convert into cash for a profit. However, if an asset is not turned over, working capital gets tied up in stock. If a business uses borrowed capital for purchasing inventory, idle inventory would result in increased finance costs. In addition, inventory not turned over would also contribute to increase in carrying costs such as storage costs and insurance costs.
The main reason why inventory turnover rates are important is to determine how successful a company has been in converting their inventory purchases into final sales.
2. Average days to sell
Average days to sell shows how long this stock is sitting in stock on hand before it is sold. To calculate average days to sell:

This ratio will differ between industries so you should compare it to your own historical results and to the ratios of competitors in the industry.
3. Backorder
The backorder rate is the percentage of orders that cannot be delivered by the scheduled time but that will be eventually delivered at a later date. Backorders are one of the most important metrics to gauge how well you’re doing when it comes to customer satisfaction — no one wants the hassle of delayed deliveries. To calculate the backorder rate:
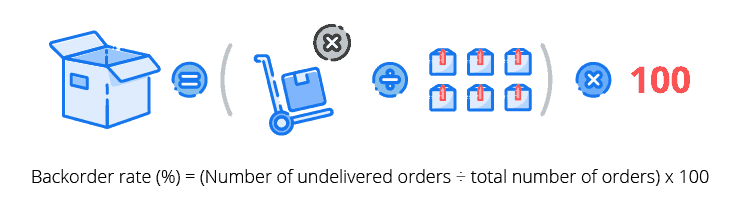
A high backorder rate means your customers have to wait while you attempt to fulfil their order, which negatively impacts customer satisfaction and retention.
4. Fill rate
The fill rate tells you the percentage of your orders that can be satisfied immediately by the available stock on hand. Understanding the fill rate is important because it can indicate customer satisfaction and loyalty. To calculate your inventory fill rate: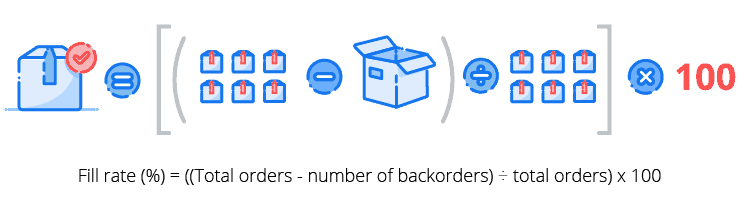
The higher the item fill rate is, the better the inventory performance is. A low fill rate means that your business doesn’t have enough stock on hand to fulfil orders. This might encourage your customers to choose your competitor over you.
5. Aged inventory report
Aged inventory is dated inventory stock that has past its prime selling point and is building up in your warehouse. Aged inventory can pile up and because it’s old, it can be hard to sell to customers.
An aged inventory report details the key metrics about your stock, in particular:
- How long each item of inventory typically spends in storage before it’s used
- Storage and other maintenance costs incurred when the goods are held in inventory
- The inventory management approach used for each item type
With an aged inventory report, your business will be able to make well-informed purchasing decisions based on how quickly stock moves. This will allow you to focus your attention on products that need it and help you understand how your stock is performing against the industry benchmark.
Stock that is sitting in your warehouse unsold is capital that you can’t use. To free up cash for purchasing and replenishment, you need to get rid of aged inventory.
Learn how to get rid of aged inventory
Bonus: Vend has compiled a useful list of six additional inventory metrics you could track (and how to do it).
Read more: Aged Inventory Reports: What are they and how do they impact inventory control?
Sales order reporting
A sales order report gives you a bird’s eye view of your sales — how much did you make in a month? How does that compare across different time periods? A sales order report lets you keep a finger on the pulse of your business.
In order to glean more value from your sales report, you need to drill down to some of the following metrics:
1. Sales count per product and product type
A sales count per product report makes it easy to identify the best and worst performing products. This helps inform procurement decisions. For example, if a product is doing well, you might consider ordering more of it. However, if a product is moving slowly, you might consider selling it at a discount to get rid of excess stock.
A sales count by product type allows you to categorise your products to see how each group contributes to revenue. Businesses use this report to identify broader trends and insights.
Read more: Why Sales Reports are Important to Inventory Management
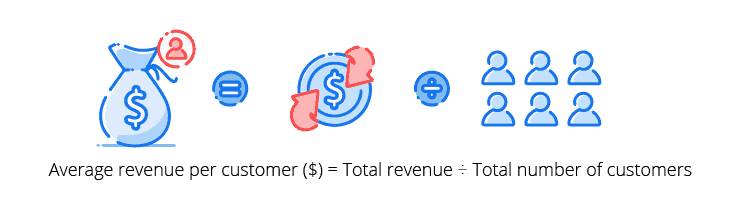
2. Average spend per customer
You probably know what your revenue is, but do you know what your average revenue per customer is? To calculate this:
3. Sales per customer or customer group
A sales report by customer or customer group allows you to identify your star customers — and those who aren’t engaging with your brand. This allows you to adjust your marketing and communications strategies accordingly. When you can easily identify the top 20% of your customers who contribute a large portion of your revenue, you’ll be able to actively engage them to drive stronger customer loyalty.
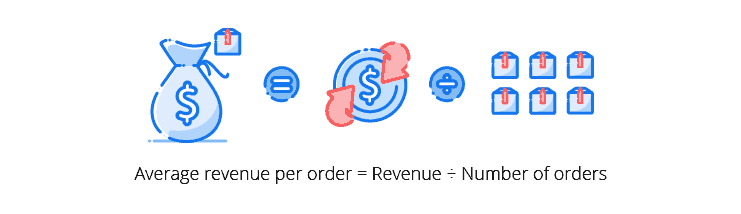
4. Average revenue per order
Average revenue per order, otherwise known as the average order value, measures the average total of every order placed with a merchant over a defined period of time. To calculate this, we use the formula:
5. Repeat order rate
The repeat order rate shows you the percentage of your current customer base that has purchased for a second time or more. This metric is a good indicator of the value you are providing your customers. To calculate it:
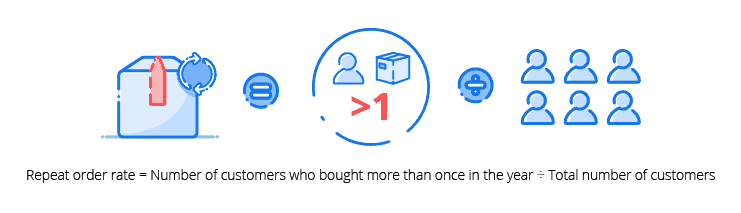
A good repeat purchase rate is dependent on the industry. A high repeat order rate indicates your customers are finding value in your business.
Fulfilling sales orders is a crucial step. Identify how well you’re serving your customers and fulfilling orders with these metrics:
1. On time deliveries
On time delivery rates measure your business’ ability to honour target shipment dates when fulfilling customer orders. Failing to deliver orders on time can put a strain on your customer relationships in the long term and negatively impact your bottom line. To calculate on time deliveries:
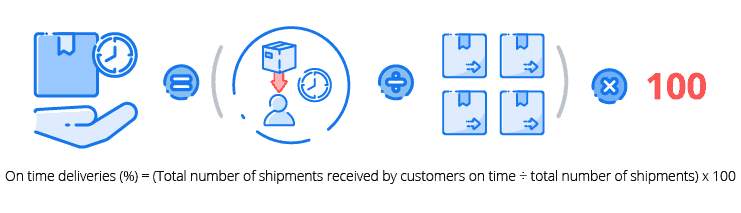
A low rate of on time deliveries hint at weaknesses in the order fulfilment process, whether that is picking, packing or shipping. Manual tasks can also lead to higher rates of late deliveries. Good product businesses will mitigate this by using an efficient system, aiming for accurate demand forecasting, implementing efficient warehouse workflows and exercising great inventory control.
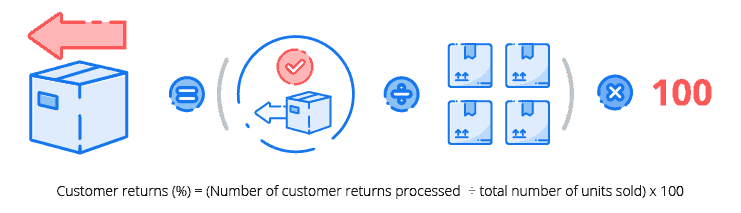
2. Customer returns
The journey doesn’t end once the product is in the customer’s hands. You need to make sure that the customer is satisfied with the product. You can manage this by monitoring customer returns by product to identify any product quality issues, selling problems or customer satisfaction shortfalls. To calculate returns as a percentage of items sold:
Dedicated inventory management software enables quick and accurate reporting across your purchasing, production, stock and sales processes. It offers advanced functionality to give you valuable insight to your business and support your growth.
Find out more about inventory management software.
Start your free 14-day Unleashed trial now. All features included. No credit card needed. Sign up now
