
COGS?
COGS works out how much it costs to sell your products, taking into account such factors as material costs, labour, overheads and so on. It does not, however, take into account certain indirect expenses such as utilities, shipping fees and marketing. To work it out, take the total value of your inventory at the beginning of a time period and add any additional purchases made during the time period. Then, subtract the final value of your inventory at the end of the period. Now you know how much you inventory cost for the period.
Beginning Inventory Value + Purchases Made, minus Final Inventory Value
Average inventory?
Average inventory is the estimated value of your inventory throughout a time period. Using this formula allows you to average out your value across time, flattening the peaks and troughs of, say, seasonal changes. To work it out, add the value of your inventory at the beginning of your time period with the value at the end of your time period, then divide both by two.
Beginning Inventory Value + Final Inventory Value, divided by 2
Putting these together to spit out our inventory turnover ratio
With our COGS and average inventory in hand, plus a time period of our choice (say, the financial year), we can work out our inventory turnover. With this formula, we’re going to divide the former figure by the latter.
COGS / Average Inventory
This gives us a figure – our inventory turnover ratio – which tells us the number of times we sold through our inventory in that period. So, if our figure was three, we would know that in our financial year, we replaced our stock three times.
What is a ‘good’ inventory turnover ratio?
This is a ‘how long is a piece of string question’, but we can give you a general answer.
Generally speaking, the higher the inventory turnover figure, the faster you sold through products. For most businesses, selling through products quickly and efficiently would likely be considered a positive thing – which we explain in more detail below.
The lower the inventory turnover figure, the less you sold, which poses risks to the business (again, which we explain below).
Benefits of high inventory turnover
1. Earn more revenue
The higher your inventory turnover ratio, the more times you are selling and replacing stock. Selling more stock probably means generating greater revenue and therefore profit during that particular time period. So, you can turn a warehouse that can only hold 1,000 units at a time into a warehouse that has sold, say, 6,000.
Not only that, but keeping stock moving at an efficient speed through the warehouse and out into customers’ hands also means you could be keeping certain costs down (such as cost of goods carried), which in turn also leads to higher profits.
2. Reduce wastage
This is particularly relevant to organisations for whom spoilage is an issue. Holding onto stock is a risk – a risk that it will get damaged, or a risk that it will spoil. In either case, this could lead to lost revenue for the company as you have to dispose of said stock rather than sell it on to the customer.
With a higher inventory turnover ratio, you are keeping products flowing through the pipeline out to customers and reducing your organisation’s exposure to such risk.
3. Appeal to investors
High inventory turnover can look good to investors, potentially leading to higher investment rates.
This finding comes from a paper titled “Does Inventory Productivity Predict Future Stock Returns? A Retailing Industry Perspective”, published in 2014. Researchers looked back at publicly listed US companies from 1985 through to 2010 and found that higher inventory productivity can “strongly predict” future stock returns.
When they invested in companies with strong turnover and shorted companies without, their investments outperformed benchmarks.
Note: High turnover might not always be positive
There are instances when high inventory turnover may not be a benefit to the business.
Indeed, high turnover could also be a symptom of offering large discounts in order to clear stock quickly, itself a potential symptom of poor purchase management. If these heavy discounts are added on top of handling costs and freight charges, it may have a negative impact on revenue (despite showing up as a high inventory turnover ratio).
Risks of low inventory turnover
1. Getting stuck with items that you can’t sell
We alluded to this problem earlier when we spoke about turning over inventory faster. Every time you purchase products that don’t sell, you run the risk that they will spoil or, in some cases, grow obsolete. In this case, there’s nothing wrong with them – customers just don’t want to buy them anymore!
These out of date products may continue to take up space in your warehouse that blocks you from purchasing other, more desirable replacements. Here you’d need to potentially discount products until you can get them off the shelves, or else work out a deal with your supplier to buy them back. In either case, you run the risk of shredding your profit margins for that time period.
2. Loading up on too many slow products
If your company purchases a high number of expensive, slow-moving products, this can bump your inventory ratio down as these products naturally sell at a slower rate (but don’t necessarily shrink profits as a result).
It’s up to you to decide if this is bad for your business or not. Too many of these slow movers may create a risk that your company won’t generate the returns it needs for the fiscal period, especially if they take up space that you can’t then fill with fast-moving goods that help fill the gaps. They may also increase the risk of spoilage or obsolescence.
Of course, the opposite may also be true. Your company might naturally run on selling slow-moving, high-value goods, in which case the issue with your inventory turnover ratio is more about expectations than sales. You may simply have a smaller figure, and in this context that’s OK.
3. Higher carrying costs
Both of the above lead to here: higher carrying costs. Every item that sits in your warehouse and stays there isn’t generating revenue, but is generating cost. The slower you turn through your inventory, the higher these costs – think handling, insurance and other storage costs. Not to mention the cost of blocking your business from purchasing replacement goods or materials.
How to improve your inventory turnover rate
1. Work on your forecasting
Forecasting is the art of knowing what customers will want when they will want it. Nailing this step enables your company to purchase exactly what it needs for the time of year and reduce the chance of either over- or under-stocking desirable goods.
Achieving this goal should start to increase your inventory turnover as you stock up only what you require and then, as a result, sell through that stock during any given season.
But how do you forecast so accurately?
You’re going to need a system to help you. Something that gathers real, quantifiable information about what sells (and what doesn’t). Inventory management software is what it’s called, and with the right tool you can capture real-time data about each SKU in your warehouse, examine historical trends, and then combine that with your own market research (i.e. upcoming major events) to determine what level of stock to purchase.
2. Try to automate
The second benefit you can gain from investing in data is the power to automate. Automation is the act of allowing a computer – often powered by AI and machine learning – to help perform menial, time-consuming tasks that it would take a human hours to do, freeing up your people to work on more value-adding activities.
In the case of inventory management software, automation can take that real-time data we talked about collecting before and put it to use. Say the computer notices that a particular item is running low on stock. Well, if allowed to do so, it could automatically ping your distributors for restocking, or if not, it could ping your inventory managers and let them know. Or perhaps a range of products is underperforming. If it lets you know, you’d know not to buy more of that product just yet, or perhaps never again.
Automation can also be used to generate reports and insights. A computer can generally do in a few seconds what it would take a human days to achieve – combing through line after line of data looking for trends, producing easy to digest charts and graphs so you can quickly see the insights.
3. Turn to marketing
Higher inventory turnover is generally generated through selling. So, in order to take a low turnover ratio and turn it into a desirable ratio, you may need to invest some time and energy into marketing.
If you know specifically which products aren’t selling, or perhaps you just want to move through all of your stock more broadly, you can design targeted campaigns aimed at pushing for faster sales. Perhaps you’ll run a special event, or offer in-store discounts.
With the power of digital marketing in particular, you can specifically hone in on the right people, in the right place, at the right time, increasing the cost efficiency of your marketing efforts by talking to customers who are most likely to actually buy something.
4. Get rid of old stock and excess inventory
You can probably tell by now that hanging on to excess old stock can drive down that ratio, and therefore drive up those costs. So, your best bet to improving your inventory turnover ratio may be simply to push to get rid of the chaff.
Perhaps now is the time to run some kind of special clearance sale, or offer unique discounts on last-season or soon-to-spoil items. These discounts may temporarily harm profits, depending on their severity, but if they free up your space to stock desirable goods that sell faster, you may be able to recoup those losses before the end of your time period.
If after all of this you’re still left with excess stock, as we suggested earlier, some suppliers may be willing to repurchase it back off of you at a discount. It never hurts to try and negotiate!
- Read more: 6 Ways SMEs Can Improve Inventory Turnover (And Why it Matters)
What is days sales of inventory?
As you investigate your inventory turnover ratio, you may also hear of a particular calculation called days sales of inventory (DSI), also known as days inventory outstanding or average age of inventory.
This is a similar metric to inventory turnover, but instead of calculating a ratio that indicates the number of times you replace your stock, it can tell you the average number of days this process takes.
How do you calculate days sales of inventory?
To calculate your DSI, you will need:
- Average inventory
- COGS
What you need to do is divide one by the other – average inventory over COGS – and then multiply them by your time period, generally 365 days. This should spit out a number of days that is equal to the average time it took during that period to replace your inventory levels.
Average Inventory / COGS, multiplied by 365
Days sales of inventory vs. inventory turnover
These are, essentially, the same metric – portrayed in slightly different ways. Really, the former is an annualised version of the latter.
When your DSI is low, you’ll see that you are selling through your stock in less time. When it’s higher, it’s taking you more days to get through your inventory. Where turnover is a general marker of sales efficiency, some business leaders prefer DSI as it portrays a more accurate calendar of the company’s inventory management efforts.
Days sales of inventory in Unleashed Software
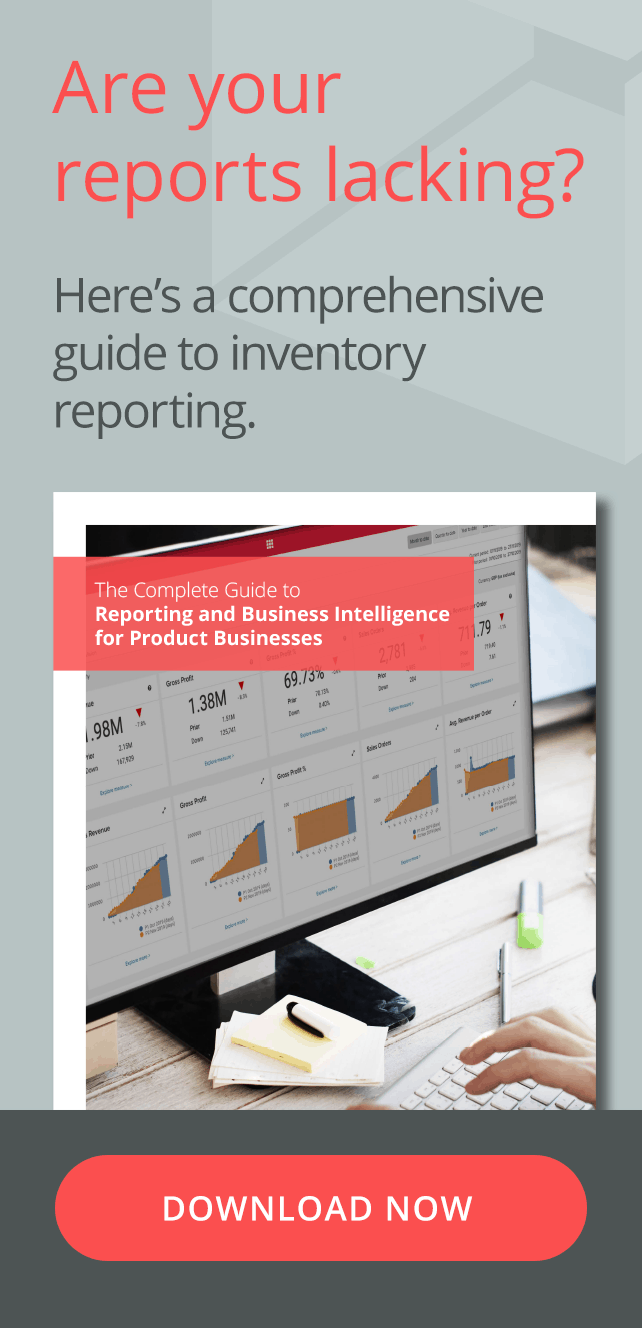
You could sit for hours on end calculating your inventory turnover or you could use inventory management software to build your inventory reports quickly and effortlessly.
In the Unleashed BI module, we process your sales and inventory data to spit out the inventory turnover figure — in the software that’s called average days to sell.
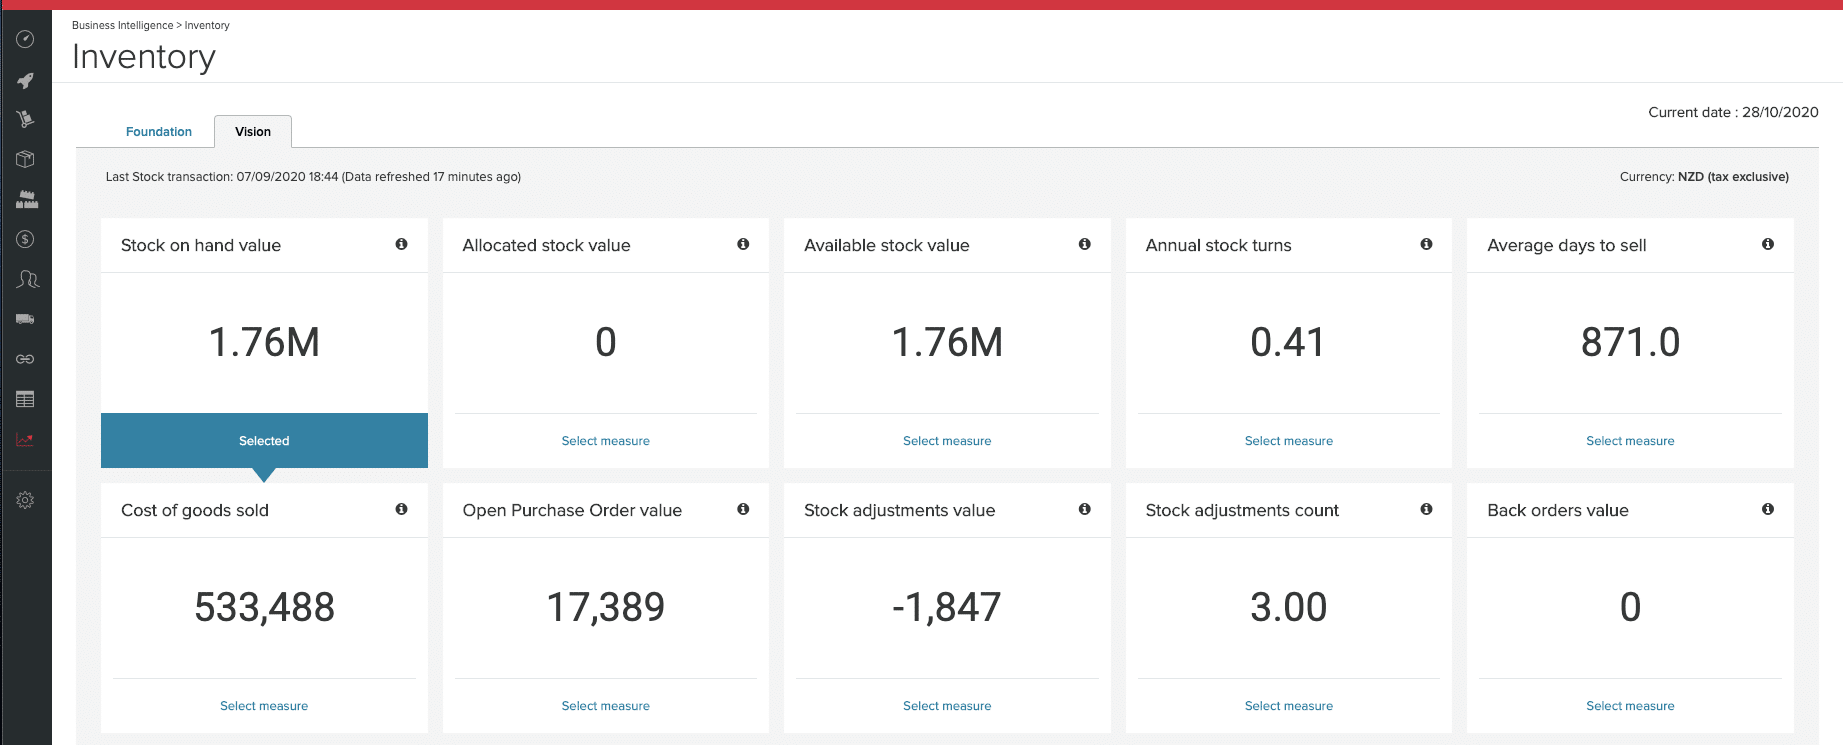
This KPI is available to both BI Foundation and BI Vision users. Navigate to the Inventory page, then you’ll see a dashboard with many KPI tiles, including average days to sell, stock on hand, value of open purchase orders and more.
Analyse your average days to sell across dimensions including warehouse, products, product groups and the age of your stock.

